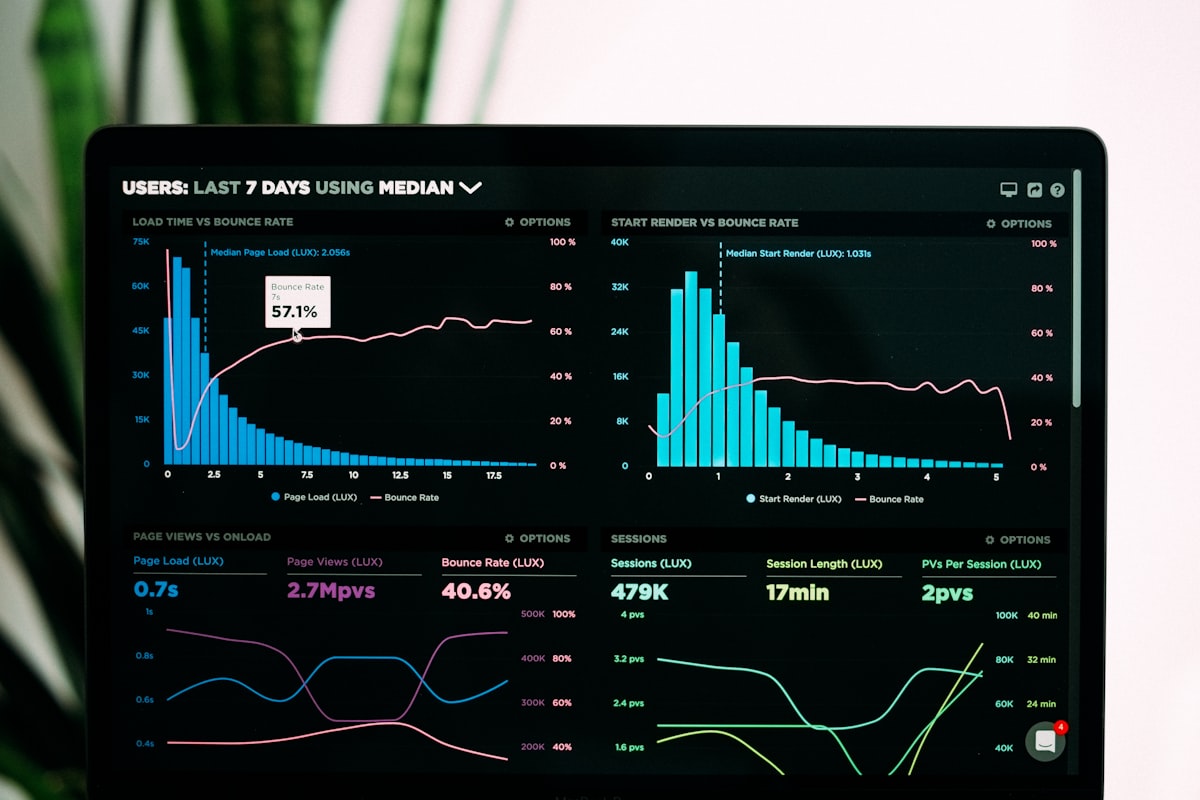
Introduction to IMB360 Analytics Dashboard
Influencers today are no longer just creators; they're also strategists, marketers, and business owners. With millions of voices competing for attention on platforms like Instagram, YouTube, and Facebook, standing out requires more than just creativity. That's where the IMB360 Analytics Dashboard comes in.
This tool is designed to give influencers a clear picture of their reach, engagement, performance trends, demographics, and content success—all in one place. By turning numbers into actionable insights, it helps influencers grow their fanbase, collaborate with brands more effectively, and optimize campaigns for better results.
If you're serious about scaling your influence, understanding your analytics is just as important as posting that perfect reel or video. This article will walk you through the IMB360 Analytics Dashboard step by step, showing you exactly how to use each feature to grow your audience and increase engagement.
Why Analytics Matter for Influencers
Many influencers start their journey by focusing only on content. But the ones who build long-term careers know that data is power. Analytics provide a roadmap for growth, helping you understand your audience and optimize your strategy.
Without analytics, influencers are essentially creating in the dark. But with tools like IMB360, every post, story, or video can be backed by real-time insights that lead to better decisions.

Key Benefits of Analytics for Influencers
Understand Audience Behavior
See who engages with your content and why
Identify Trends
Spot what's working and what's not performing
Show Value to Brands
Use hard numbers to negotiate better deals
Understanding Total Reach
What is Total Reach?
At the top of the dashboard, you'll see Total Reach—in this example, 2.1M. Reach represents the number of unique users who have seen your content. For influencers, it's not just about how many people follow you; it's about how many actually see what you share.
Why Reach Matters
It shows content visibility, impacts brand deals, and guides posting strategies. High reach at certain times of day suggests when your audience is most active.
Breaking Down Engagement Metrics

What is Engagement?
While reach tells you how many people saw your content, engagement metrics reveal how many cared enough to interact. Engagement includes likes, comments, shares, saves, and clicks.

Boosting Engagement
Use engagement-driven content like polls, questions, and challenges. Post consistently but avoid over-posting, which can reduce interaction.
Performance Trends Over Time
Seasonal Patterns
Detect engagement patterns during holidays and weekends
Campaign Impact
Track the impact of campaigns or collaborations
Strategy Effectiveness
Measure the effectiveness of content strategies over time
Data-Driven Growth
Prevents relying on gut feeling with clear roadmap
Platform Distribution Analysis
YouTube Focus Strategy
If YouTube is driving most of your reach, invest in long-form content and video tutorials.
Instagram Optimization
If Instagram dominates, focus on Reels, Stories, and visual storytelling.
Facebook Engagement
If Facebook is performing better, experiment with groups and shareable posts.
Demographic Insights for Targeting
Age Demographics
The Age Demographics chart reveals which age group engages most with your content. This helps tailor your messaging and influences brand partnerships.
Gender Split Analysis
Understanding your gender split helps adjust tone, topics, and visuals accordingly. Brands love gender data for laser-targeted campaigns.
Geographic Targeting
Top Locations data helps with localized content, regional brand deals, and optimal posting times for your audience.
Content Performance Deep Dive
Top Performing Content
Shows which posts did best in terms of reach, engagement, and likes. Helps you replicate success and guides content calendar planning.
Platform-Specific Performance
Reveals which platform drives better results for certain formats like images versus videos.

Case Study: Turning Analytics into Growth

Sara's Growth Story
From 50K followers to 1.2M reach in 3 months
Imagine an influencer named Sara, who had 50K followers but stagnant growth. Using IMB360:
- • She discovered her YouTube Shorts were outperforming Instagram posts
- • She shifted 70% of her effort to YouTube
- • Her reach grew by 1.2M in three months
- • Engagement doubled after she tailored content to her 26–40 age demographic
Sara's story proves that analytics isn't just numbers—it's the secret weapon for growth.
Practical Tips to Improve Dashboard Numbers
- •Post consistently on your best-performing platform
- •Create content around audience demographics
- •Repurpose top-performing posts into new formats
- •Collaborate with influencers who share similar audience
- •Run small ad campaigns to test new markets
- •Use analytics when pitching to brands
Future of Influencer Analytics
AI-Driven Insights
Analytics dashboards will become smarter with AI-driven insights for predicting performance and automated reporting tools.
Cross-Platform Integration
Complete visibility across all platforms with unified reporting and comprehensive performance tracking.
Frequently Asked Questions
Get Analytics Consultation
Need help understanding your analytics or optimizing your influencer strategy? Connect with our experts.
Send Your Analytics Query
Describe your analytics question and we'll help you optimize your performance.
